MetaTrader 5 Backtesting
In order to properly analyze a potential trading strategy, it is important to ensure that the results obtained from backtesting are a true reflection of performance. Unfortunately, the history data provided within MetaTrader is not the highest quality and is limited to no more than a few years of data. The solution is to obtain your own historical data and perform 100% accurate tests, this is called tick data backtesting. In order to set up such modeling, there are a number of extra steps required which will be covered further down this page. For now, let is look at the simple and fast way to get backtesting with MT5.
Simple MT5 Backtesting
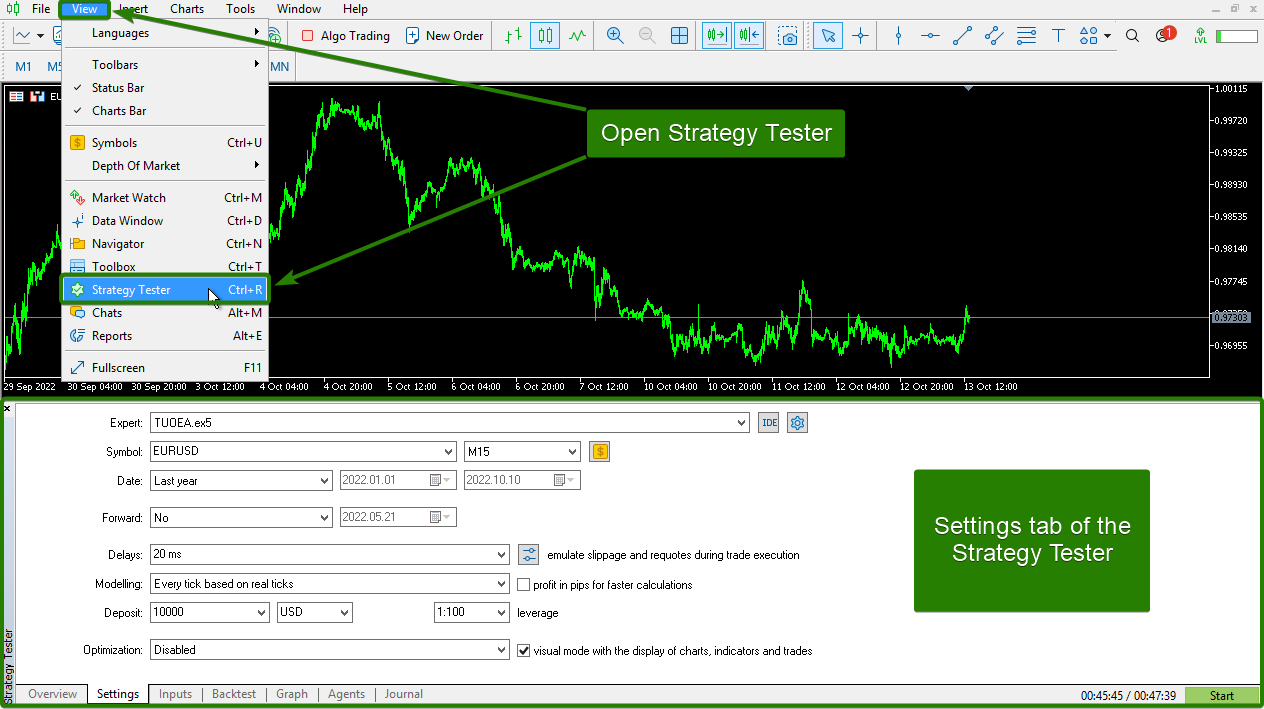
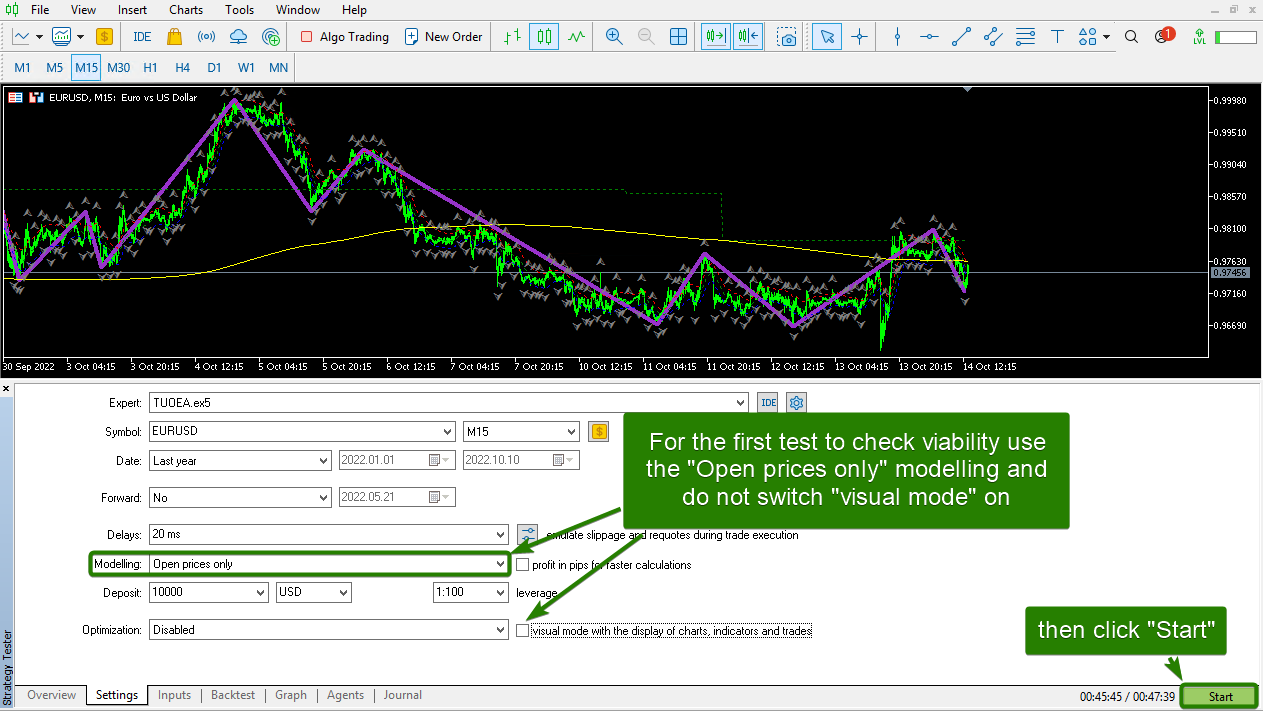
MT5’s built-in backtesting suite can be located by hitting Ctrl+R on your keyboard or by visiting the MT5 menu “View>Strategy tester”. Once the strategy tester is open you will see a series of tabs, Overview, Settings, Inputs, Agents, and Journal. The first tab to visit is the Settings tab where you will select your Expert Advisor and how your tests will run. After that, you just select your expert advisors Inputs in the next tab and then hit the Start button.
Expert
Here you will select TUOEA.ex5 as your expert advisor to test.
Symbol
Here you will select the trading symbol and timeframe you wish to test TUOEA on.
Date
Here you will choose the date range that you wish to test TUOEA on.
Forward
Here you can choose to jump forward from your selected date range above. This can be useful after you have run a test and noticed a trade you wish to re-run and watch closely to analyze (you will need to switch on visual mode to do so).
Delays
Here you can emulate real-life trading conditions such as slippage and re-quotes as per your experience with your broker. If you set the delay to a higher number than you are used to you will get to test just how robust your expert advisor is.
Modeling
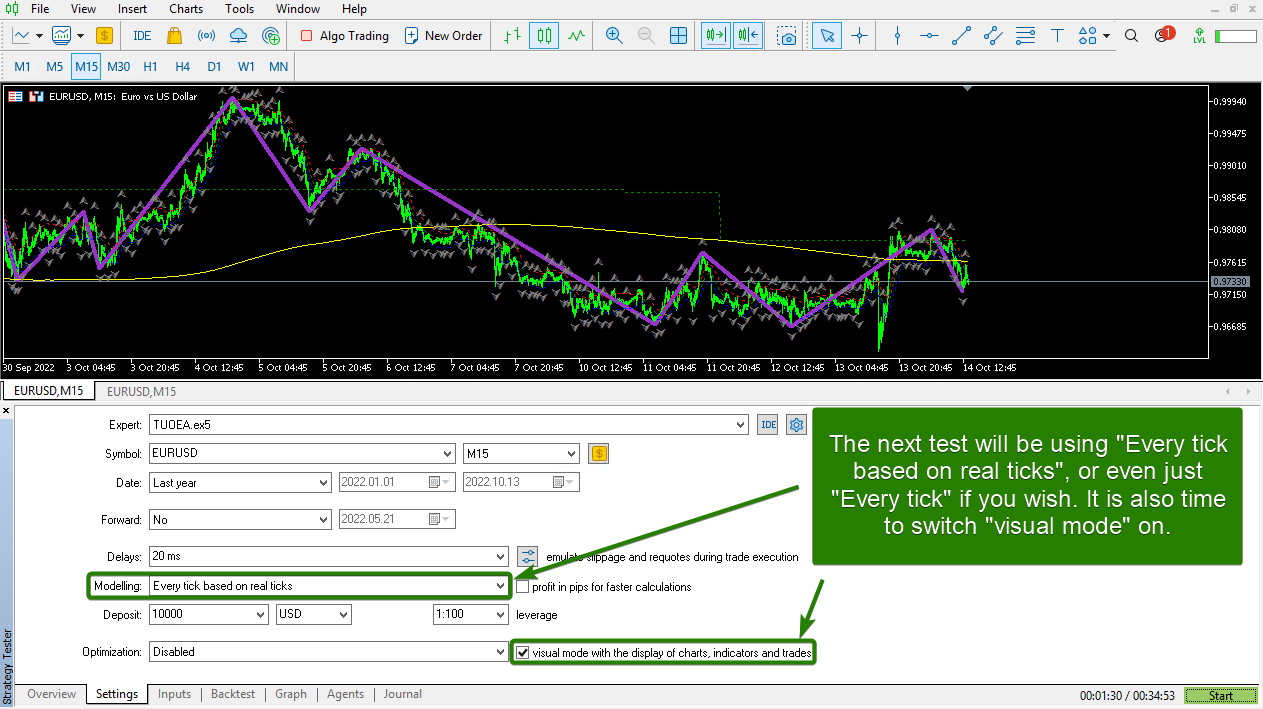
Here you can select your modeling quality which will affect the speed and accuracy of your test. The lower the modeling quality, the faster the test but with a sacrifice of quality. Running fast tests based on “Open prices only” can allow you to quickly test the viability of a strategy before committing more time to it. If your strategy looks promising you can then run a new test with “Every tick” or even “Every tick based on real ticks”, both will be discussed in more detail further down this page.
Deposit
Here you can emulate an account size, currency, and its available leverage. Always be realistic here.
Optimization
Here you can attempt to improve on a winning strategy. Always leave this disabled to start with as it will take up computer resources and time. The check box here is to switch on visual mode which will allow you to watch your expert advisor in action.
Defining Your Strategy
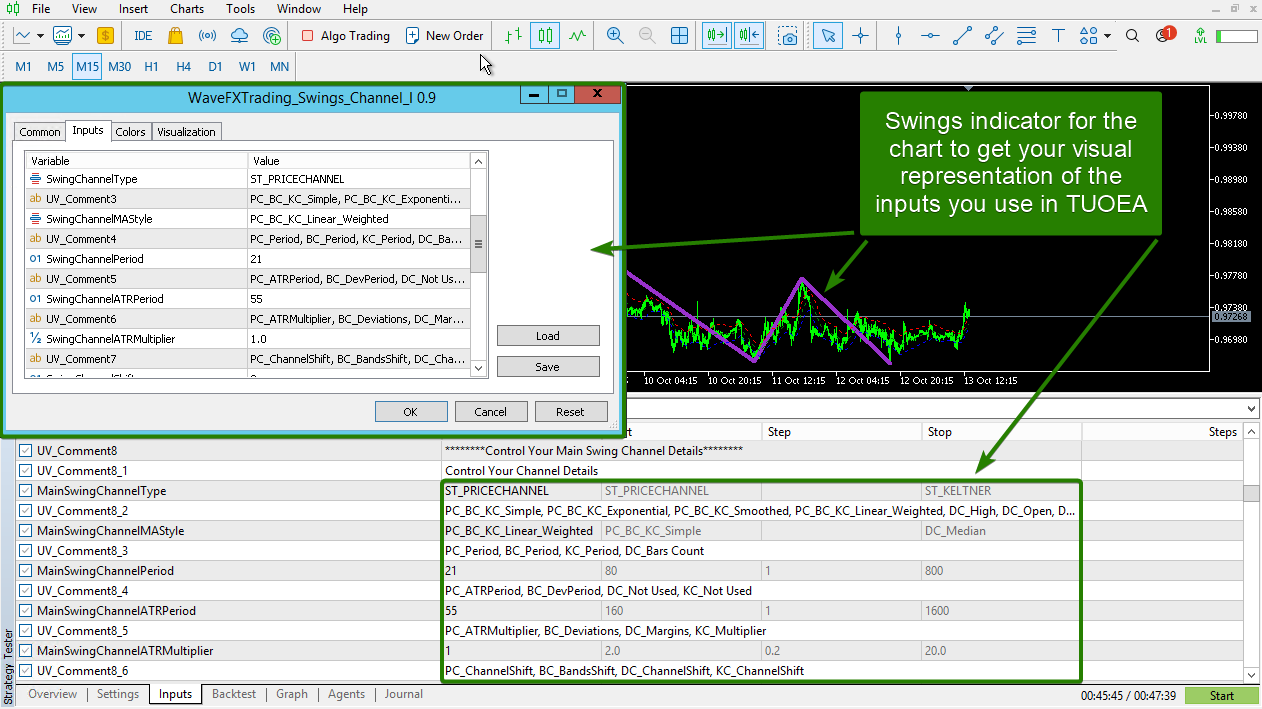
The only other tab you will need to visit to get started is the Inputs tab. This is where you will set all of the TUOEA inputs to define your trading strategy idea. The best way to do that is to first get a visual by using the provided indicators. Open a new chart of the trading symbol you wish to test and set it to the timeframe you have in mind, then apply the indicators needed for your strategy. Always start off with the “WaveFXTrading_Swings_Channel_I” indicator as it is integral to many functions within TUOEA.
Refer to the “WaveFXTrading_Swings_Channel_I” tutorial if you need a reminder about any of its settings. Once you have the visual confirmation on the chart that your swings are set up the way you want them, you can then go ahead and match its settings to those within the TUOEA. Next, you can proceed to add any other indicators you wish to do the same with. For this example, we will use the “WaveFXTrading_Donchian_Channel_I” for the TUOEA “Channel Positioning Requirements” next.
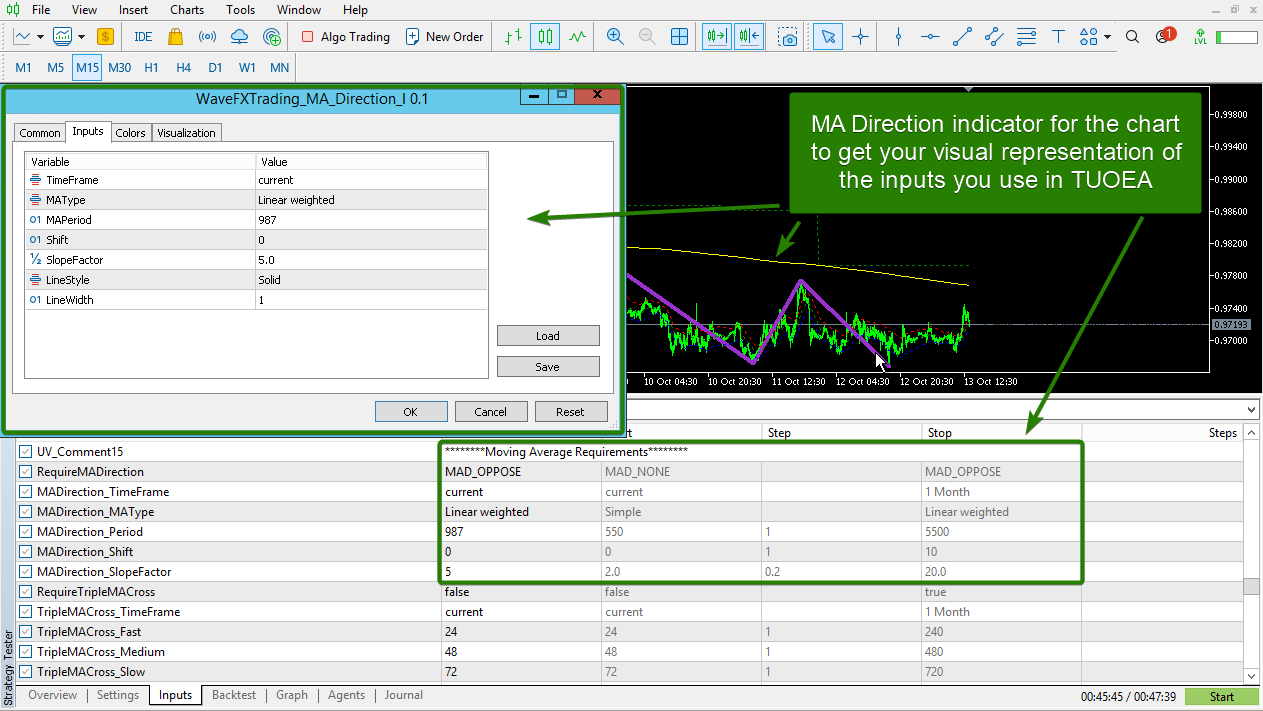
and then the “WaveFXTrading_MA_Direction_I” for the TUOEA “Moving Average Requirements”.
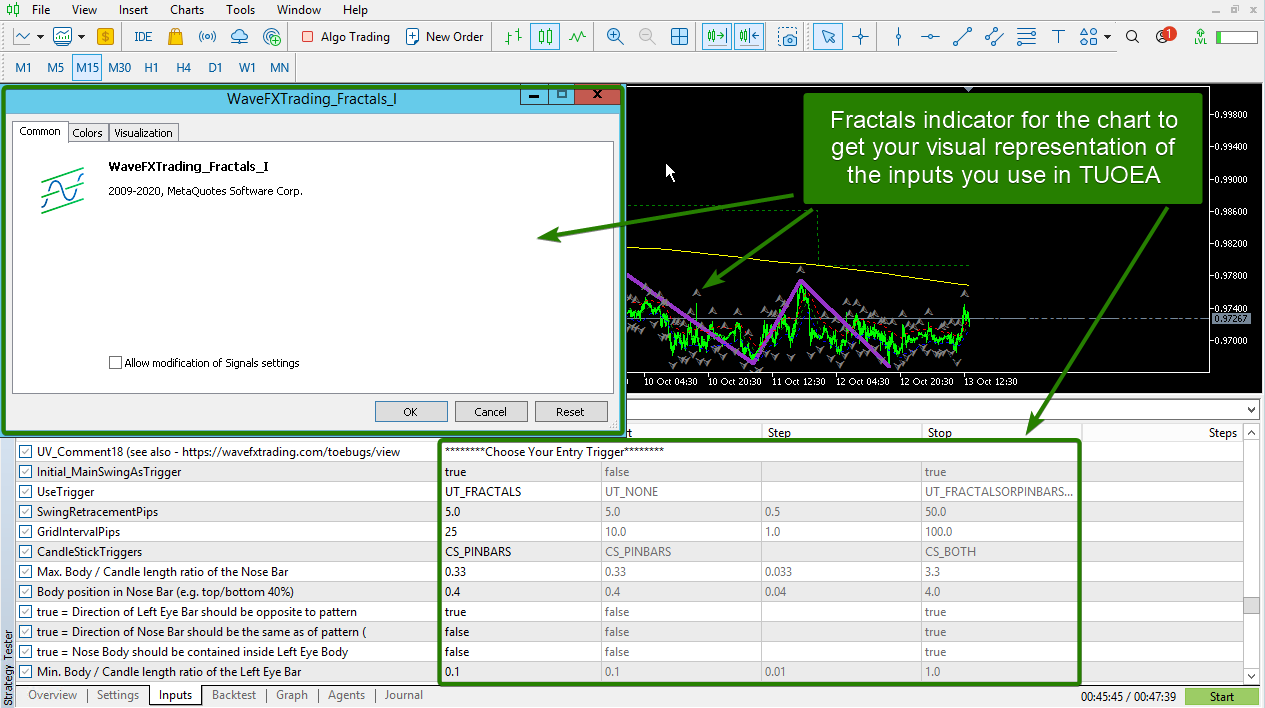
and for entry triggers, we will use the most basic of triggers, the “WaveFXTrading_Fractals_I”.
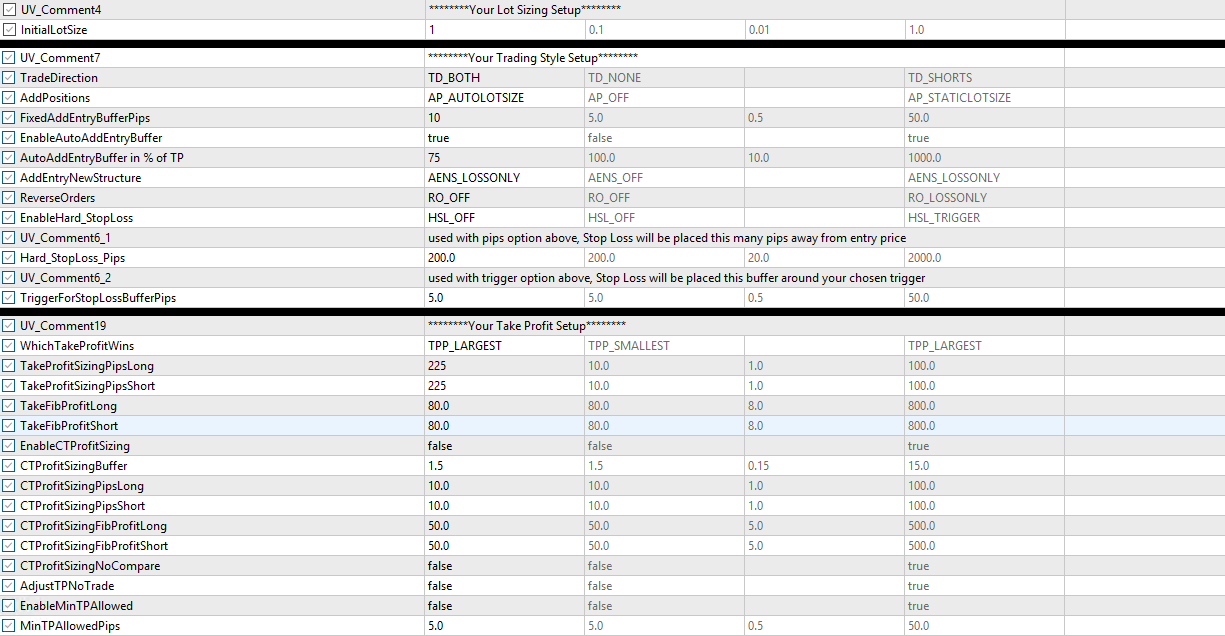
finally, all of the settings that do not require indicator visuals need to be addressed. Starting from the top of the inputs and working through them all, presets are not being used, the magic number will be left as default, the tickmultiplier will be left to auto, and we need to focus on the categorized inputs groups “Your Lot Sizing Setup”, “Your Trading Style Setup”, and “Your Take Profit Setup”.
In order to keep this tutorial as simple and short as possible, while still delivering the educational message, we are not using any of the other sections of inputs.
Running Your Test
When testing an idea it is best not to waste time so the first test can be very fast. Select around a year or so for your test and use the “Open prices only” modeling. Do not switch “visual mode” on at this point and click “Start”.
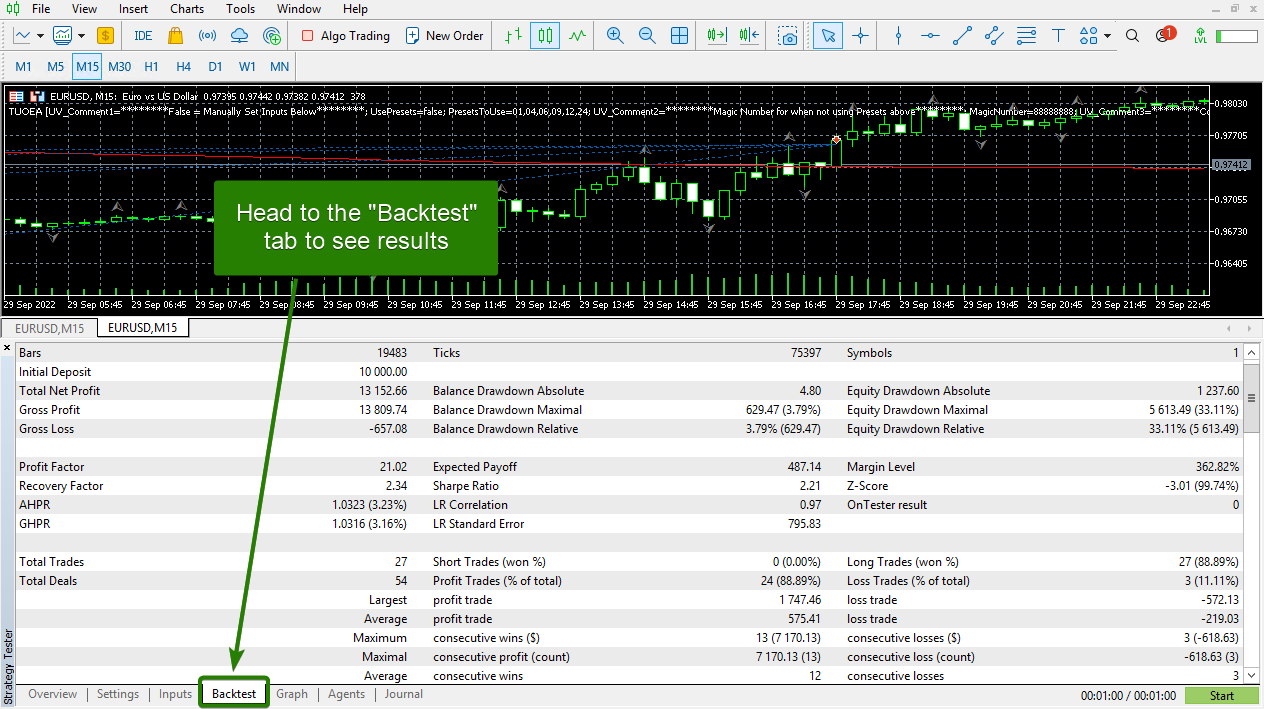
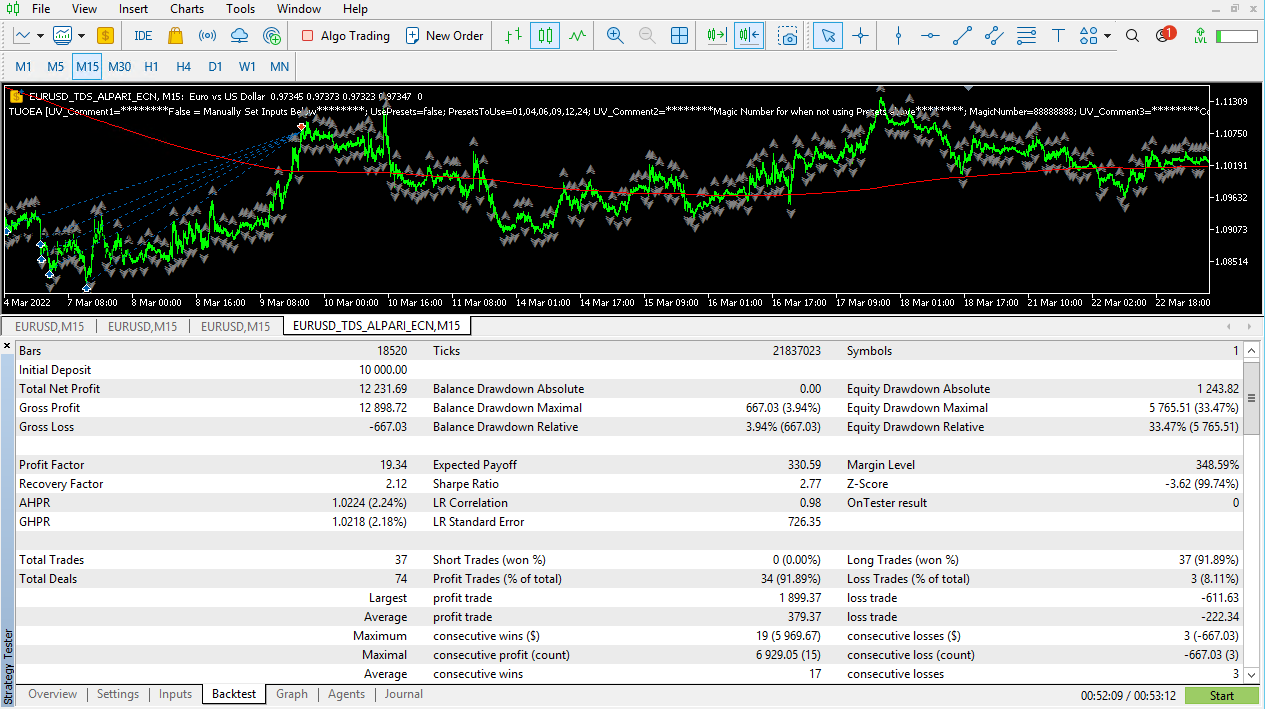
When the test is finished go to the “Backtest” tab and have a quick look at the results and check viability.
Upon initial review, it appears that this simple strategy has a 131% return in what was a 10-month test. This is quite good and the only concern is the maximum drawdown of 33%. In conclusion, the account at its worst was risking a third of its value but was able to reward you with 131% returns. It is worth further exploration to see if you can reduce that drawdown.
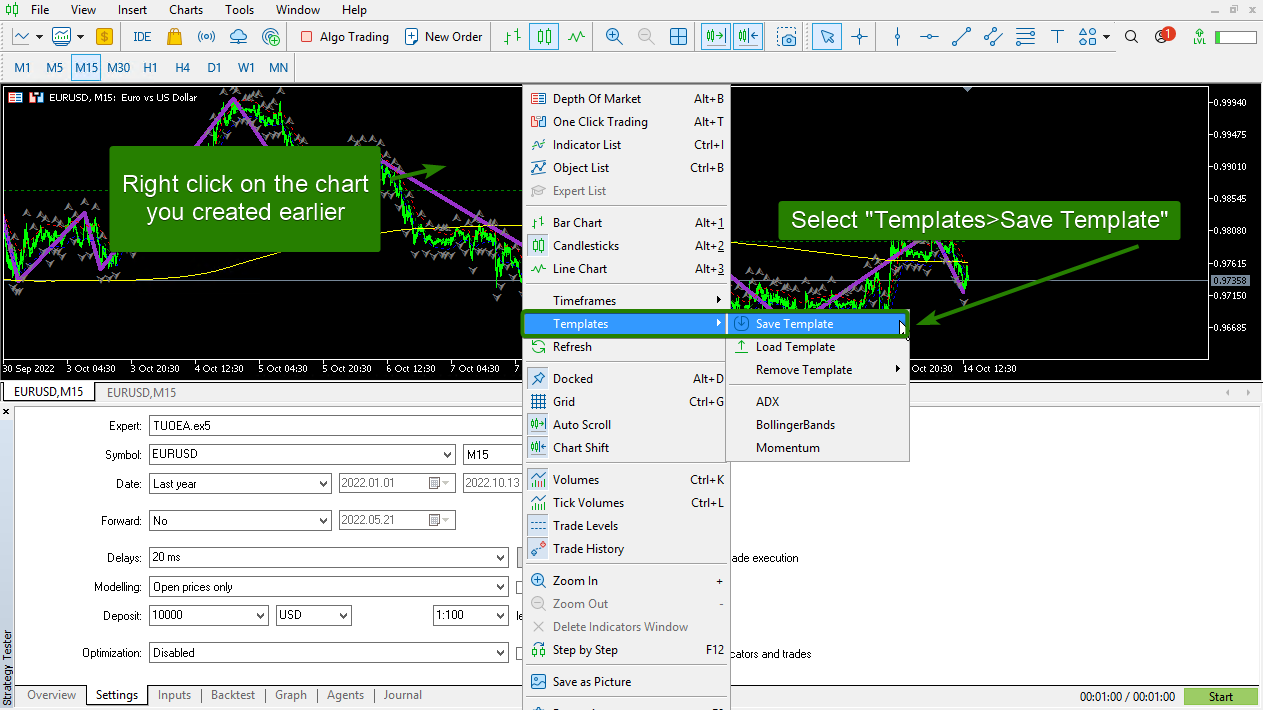
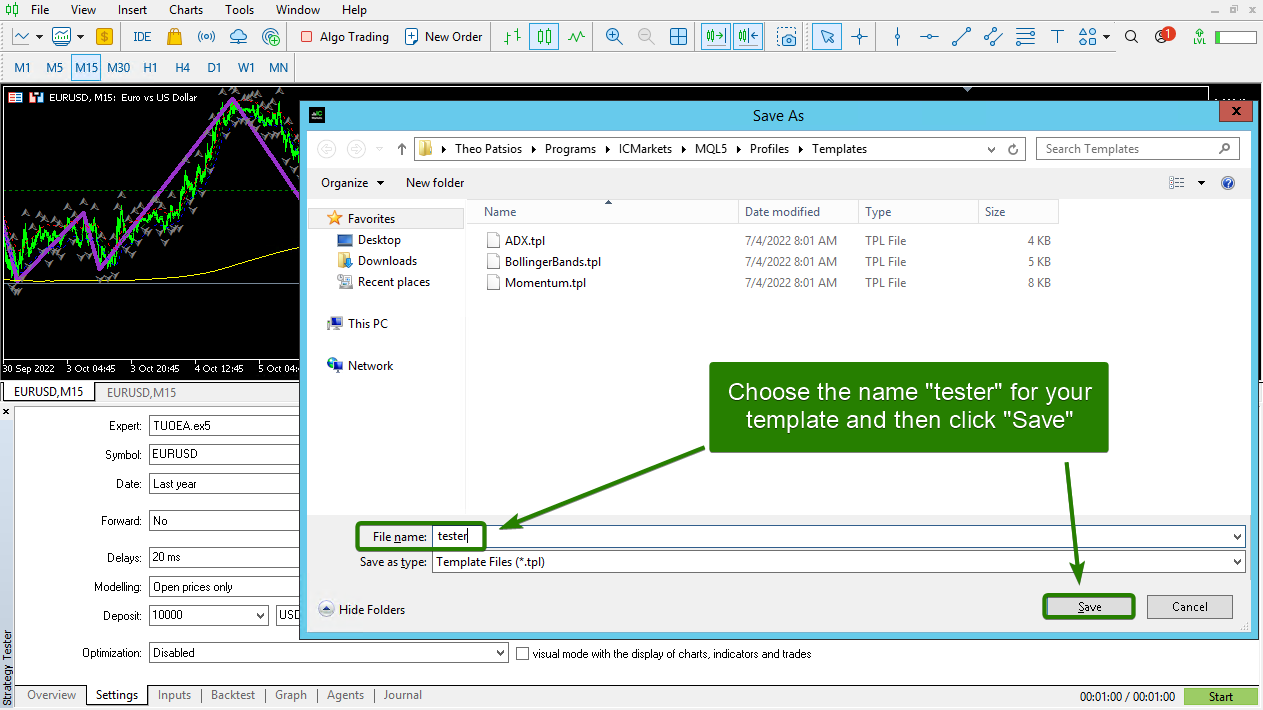
You will notice that after the test was completed a new chart was opened for you but it does not contain all the indicators we added earlier. Since our next test is more explorative it is best practice to now save a template the will allow you to analyze your strategy closer. Right-click on the chart you created with all the indicators you had applied and select “Templates>Save Template”.
Name your template “tester” and click “Save”.
The next test will be run using the template you just saved and in order to review the trades, it is time to switch “visual mode” on. At this stage it is also time to change the modeling over to “Every tick based on real ticks”, or “Every tick”. Both are acceptable at this stage. Click “Start” after you have made these changes.
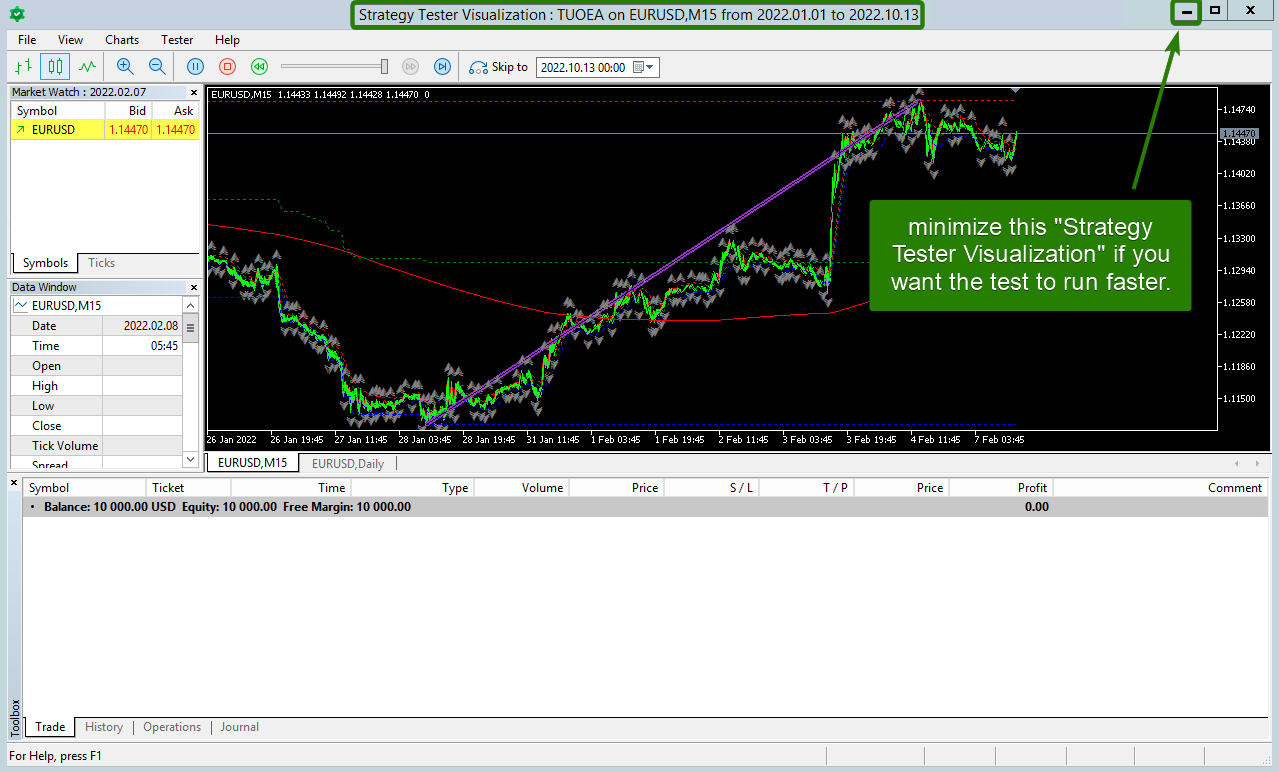
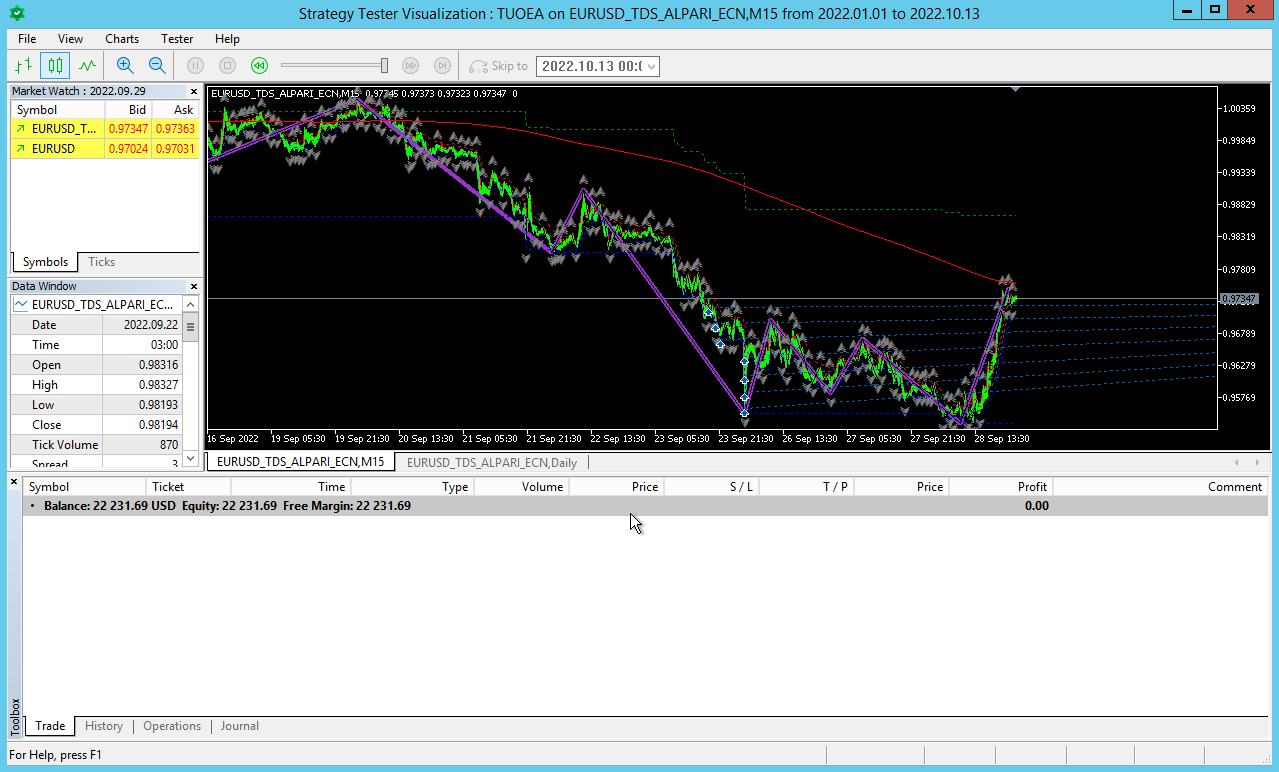
You will notice what looks like another instance of MT5 pop-up but it is just a “Strategy Tester Visualization” program. You will also notice that the tester template is now being used. If you do not wish to watch the test and instead want the test to run faster then you should minimize this window. Upon review later you can always replay any trade that you do want to watch.
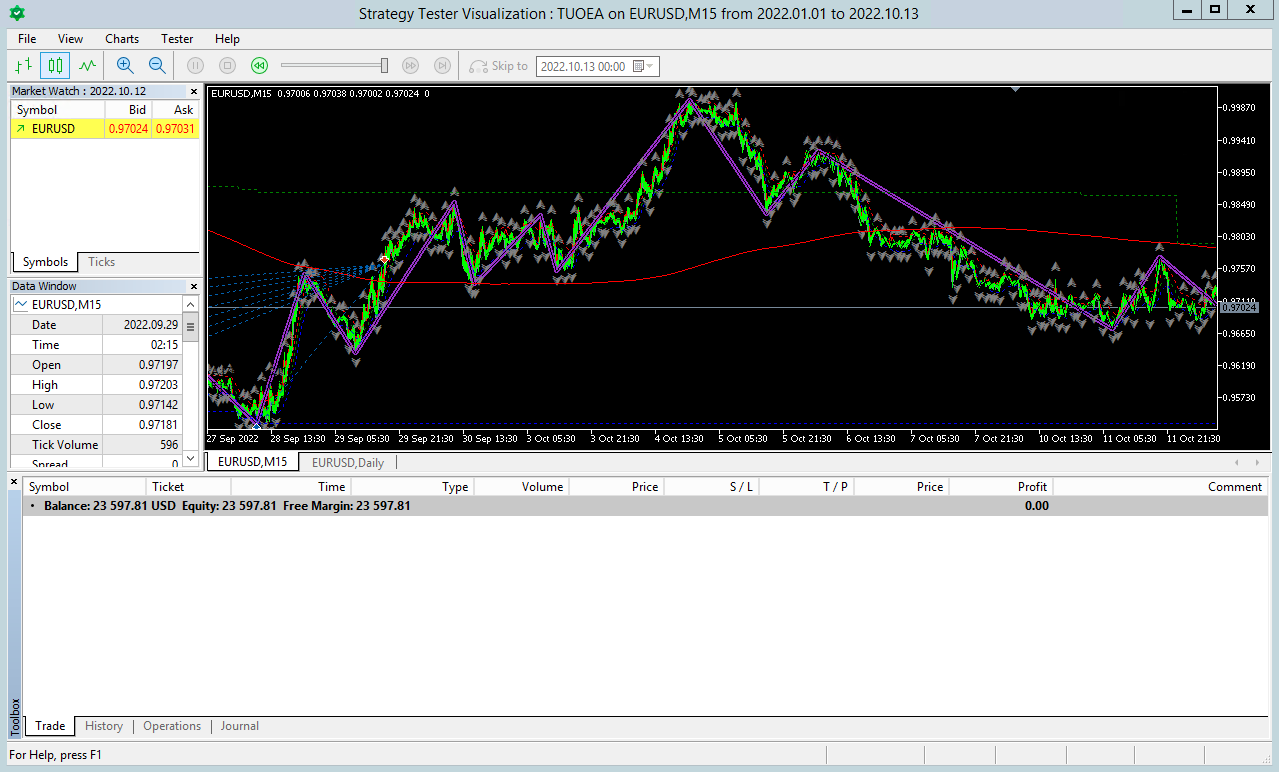
With the test complete you can see the balance at the end of the timespan tested and compare it to before. In this instance, we are not far off due to the strategy being one where the trades are lengthy and the take profits are large. If you were testing a scalping strategy this would most likely be very different. The image directly below shows the “Strategy Tester Visualization” but you can also switch back to MT5 itself and view the backtest results just as before. Most importantly, if you wanted to pursue this strategy, and do your due diligence, you need to verify the results with actual tick data.
Real Tick Data Backtesting on MT5
On MT5, backtesting using the “Every tick” option will deliver a reasonably high level of accuracy, but MT5 also offers a more accurate modeling method, namely “Every tick based on real ticks”.
The utilization of “Every tick” modeling causes a variety of issues. Prices are randomly simulated from bar data when the default tick data is downloaded via your broker. By a process of interpolation, it uses the bar price data together with the tick count to auto-generate the prices for each bar so that they start at the bar open price, touch the bar high and low, ending at the close price.
When testing using “ Every tick based on real ticks”, and requesting the tick data from the broker directly, there is a scope for missing data. If there are numerous data mismatches, this could yet again lead to an improper testing result.
To summarize, the default testing environment will not cycle through every tick that was delivered at specific points in history. This will be a lesser issue for higher timeframe EAs, but for scalping EAs, the results will diverge extensively. The solution is to use a third-party tick provider (intermediary) to allow for a user-friendly method for accurate testing with relatively low costs. The steps below will outline how to utilize Tick Data Suite (TDS) for the entire process. TDS is included for free with the managed VPS option offered here at TUOEA.com. For any other user, TDS is a paid service but does allow for a 14-Day free trial, available here.
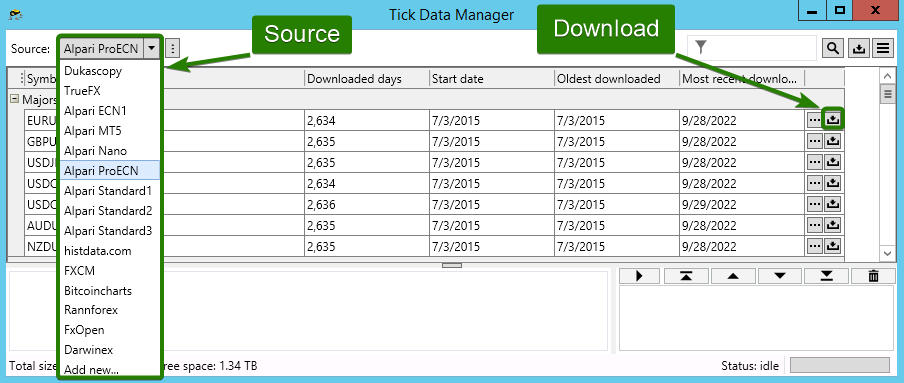
Once TDS has been downloaded, run the “ Tick Data Manager” from your desktop and choose the source (broker). Dukascopy has almost every forex, commodity, stock/equity, bonds, and more available as CFDs. Alpari ECN1 and Alpari ProECN are both ideal for users who are planning on live trading on ECN accounts (order book), but they do not offer as much historical data as Dukascopy. Therefore, if you want to backtest your EA on history data older than 2015, you will want to go for Dukascopy.
Once you have selected your data source you can then click the download button on the far right of each desired pair’s row. Users can also scroll between different sources to download pairs that may be exclusive to specific sources/brokers.
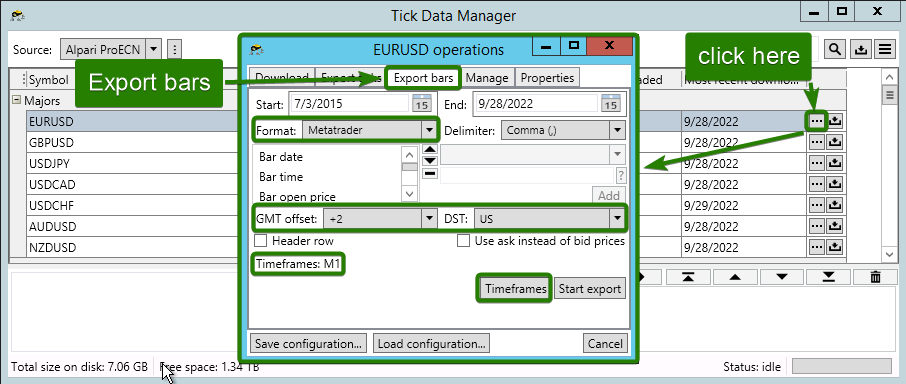
You will now need to export both the M1 bar data and the tick data from TDS and import it into MT5 for everything to work correctly. Starting with the M1 data, click on the “…” button on the far right side of a specific pair, then on the popup window click on the “Export bars” tab.
- Adjust the following parameters:
- Format: MetaTrader
- GMT offset: Check your broker, for example, IC Markets is +2
- DST: Check with your broker, for example, IC Markets DST is based on US time
- Click on the “Timeframes” button
- Select the M1 timeframe then click “OK” (see example below).
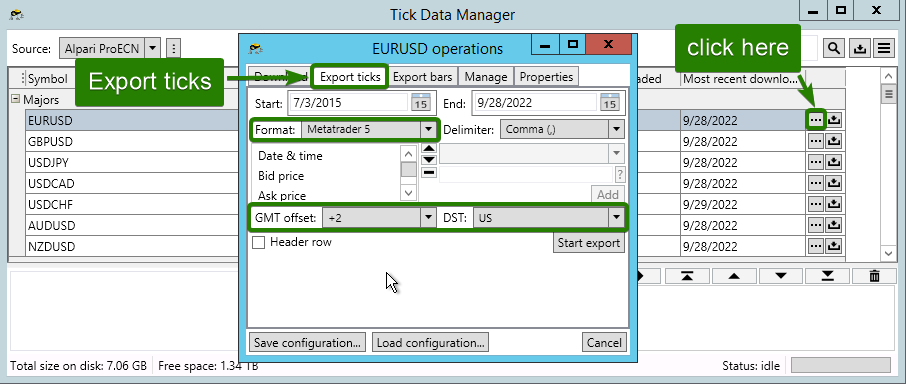
The next step is to export the ticks from Tick Data Suite. Click on the “Start export” button, then click on the “…” button on the far right side of a specific pair. On the popup window click on the “Export ticks” tab and adjust the following parameters.
- Format: MetaTrader 5
- GMT offset: Check your broker, for example, IC Markets is +2
- DST: Check with your broker, for example, IC Markets DST is based on US time
- Click on the “Start export” button.
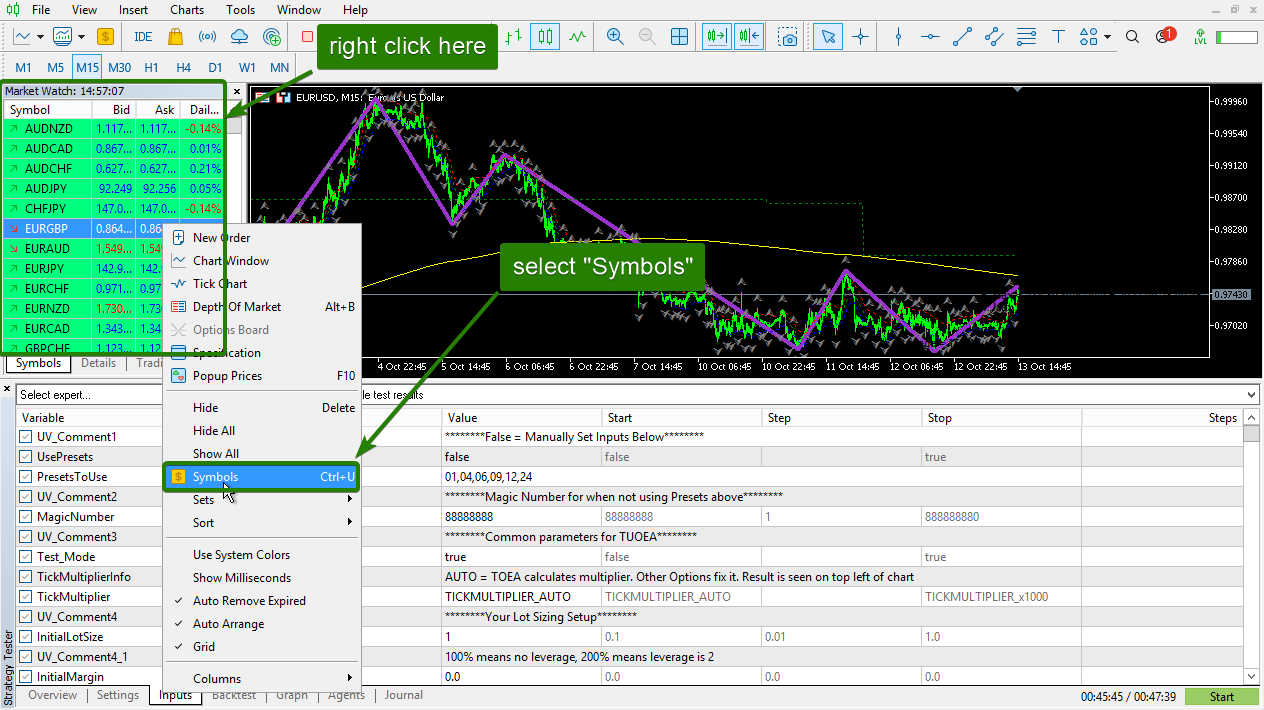
Once you have exported the M1 bar data and the tick data, you are ready to import the data into MT5. With MT5 you first need to create a custom symbol by right-clicking on the Market Watch window, then clicking on “Symbols”.
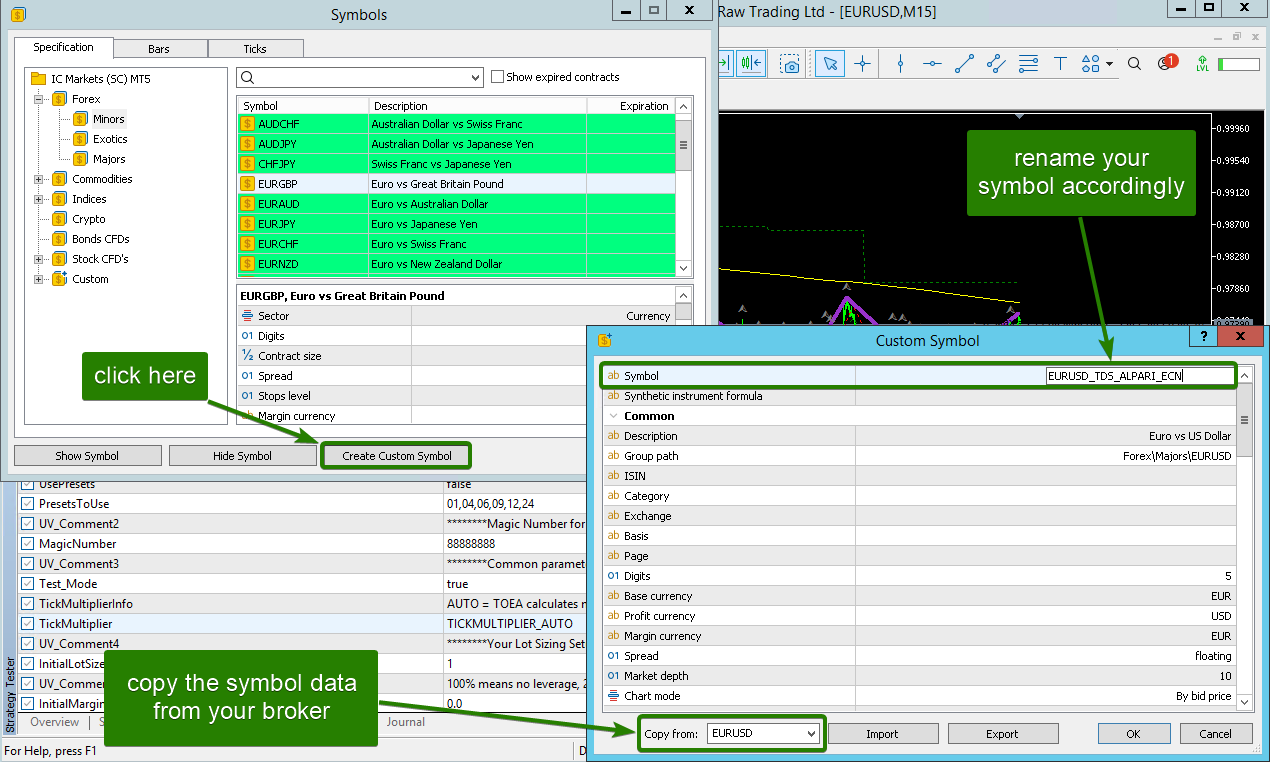
Now click on “Create Custom Symbol, then ”Within the Custom Symbol window, the process is simple. In the Copy From field, select the symbol that you would like to use. (this will copy EURUSD symbol settings from the current broker). When the symbol is inputted and loaded within the column, rename the pair to have a suffix that is something like” _TDS”. no click “OK” when all symbol settings have been confirmed.
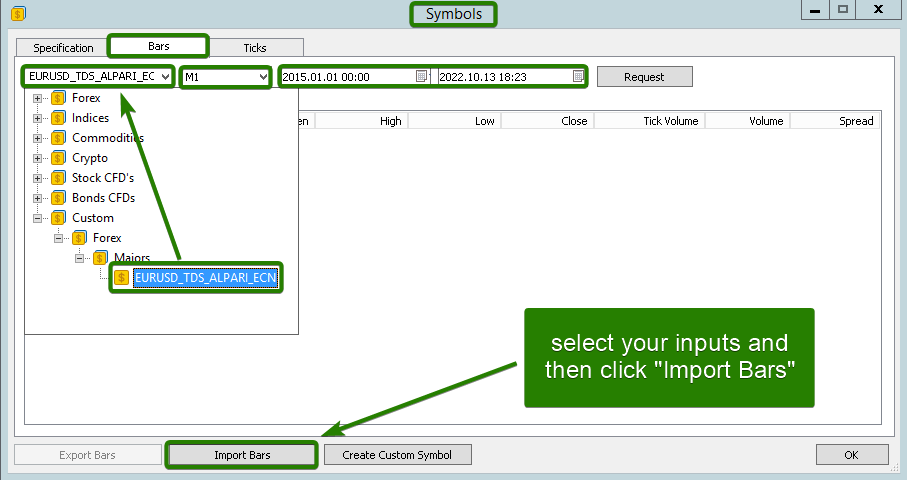
Once you have created your new custom symbol, you are now ready to import the M1 bar data and tick data into it. Firstly, for the M1 bar data, click on the “Bars” tab of the Symbols window and select your custom symbol from the dropdown input (under the Custom category within the dropdown). Once the new custom symbol has been selected, make sure that the timeframe input beside it is set to M1 and the date range is correct, then click on “Import Bars”.
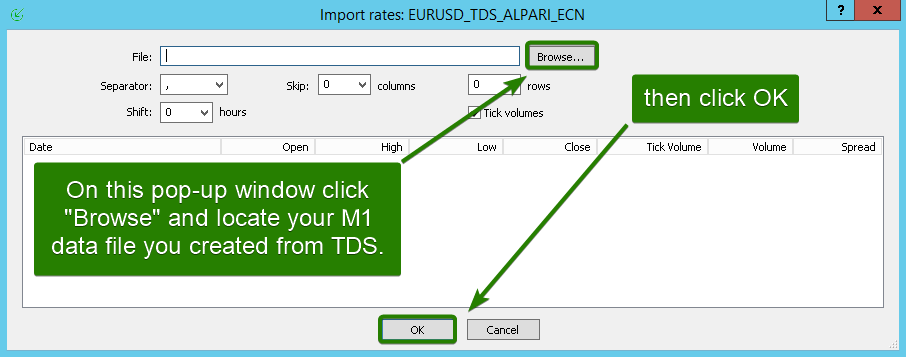
Now click on “Browse” and then select the M1 bar data file you created earlier with TDS. You will be able to distinguish the difference since the file suffix will contain _M1.csv. In this example, the distinguishing factor looks like this: EURUSD_GMT+2_US-DST_ALPARI_M1.csv
Once the import is finished, click “OK”.
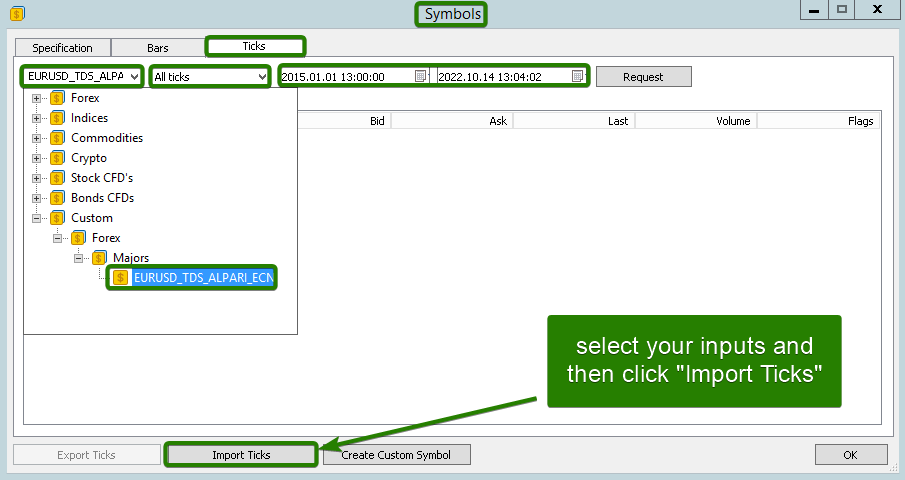
Now that you have imported the M1 bar data, the next step is to import the tick data by going to the “Ticks” tab on that same “Symbols” window. Double-check that the custom symbol is still inputted on the symbol input field. Then click on “Import Ticks”.
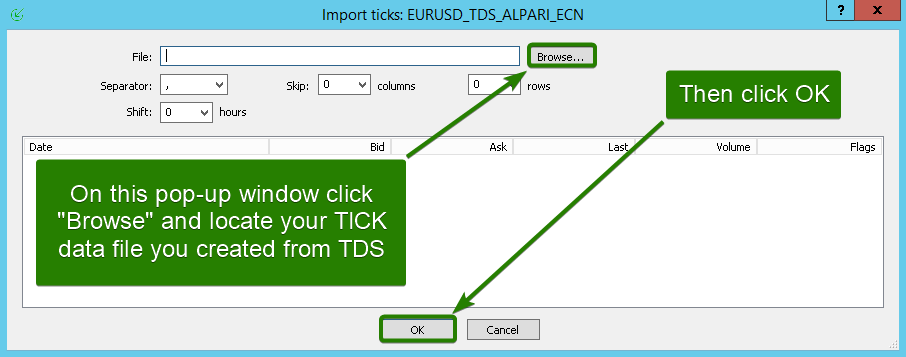
Click on “Browse”. Select the tick export file you created earlier with TDS. You will be able to distinguish the difference since the file suffix will not contain _TICKS.csv. In our example, this is the file we used: EURUSD_GMT+2_US-DST_ALPARI_TICKS.csv
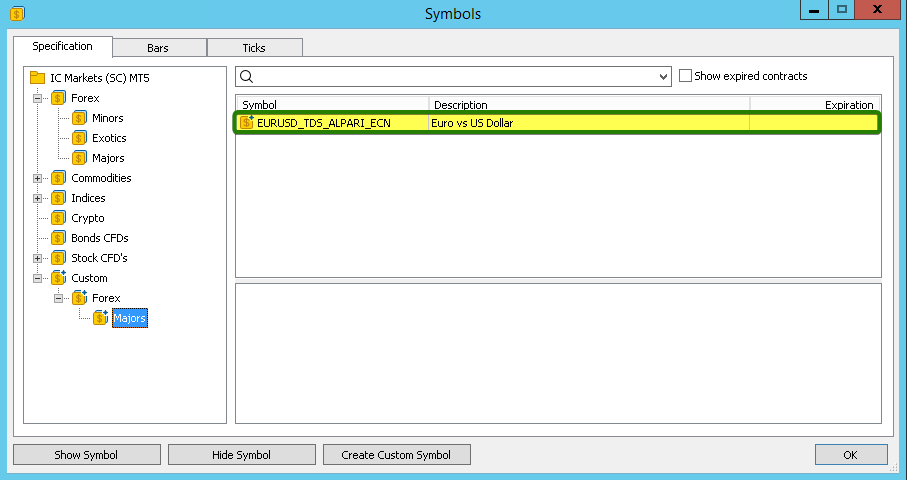
Keep all settings at their default values since any offset or formatting would’ve been accounted for by TDS. Once the import is finished, click “OK”. Now go to the Symbols window once more and make sure the new custom chart is activated. If the chart shows a yellow dollar sign icon then everything is ready and you just need to click “OK”. If the chart shows a white dollar sign icon just double-click it to make it enabled and it will become yellow. If double-clicking the new custom symbol does not enable it, restart your mt5 terminal.
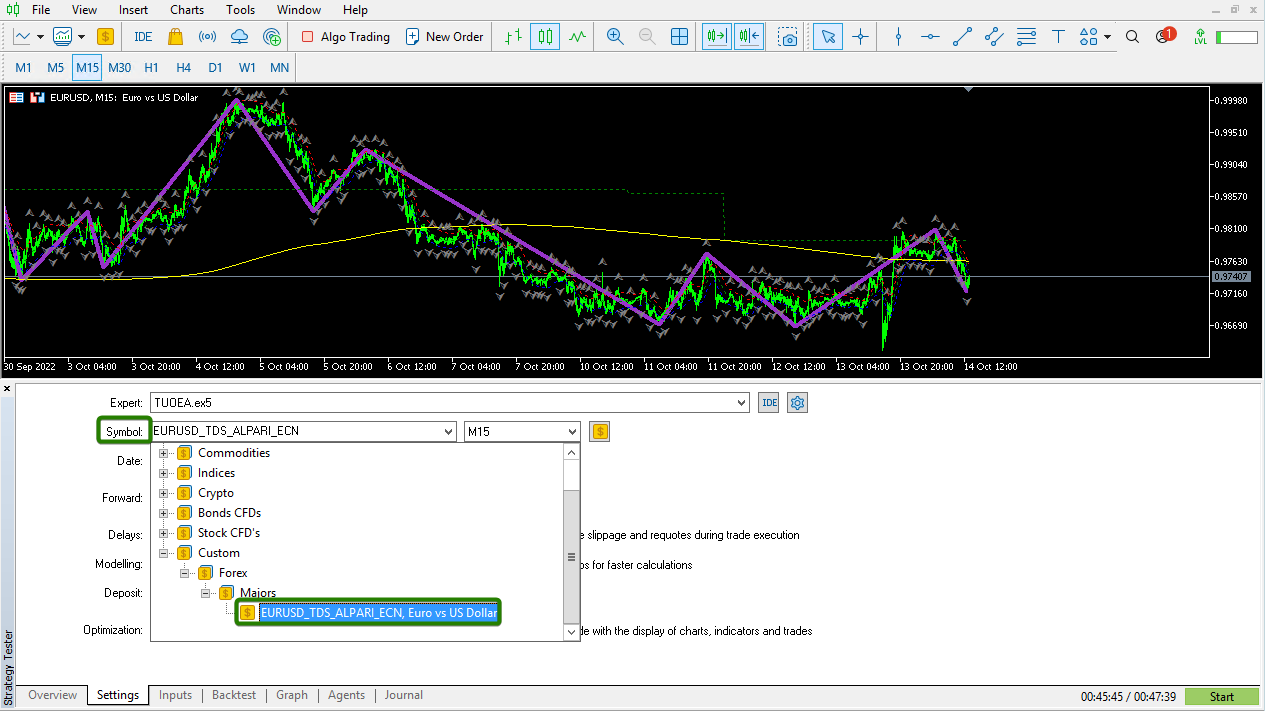
Now, when you open the strategy tester you will find a new path to your custom symbols. Simply select the new symbol and start testing your EA on it with the highest accuracy available.
Comparing Test Results
Now that your tick data custom chart is set up and ready you can run your tests again and see how they impact your results. Make sure you have your modeling set to “Every tick based on real ticks”. You can run the tests with or without visual mode depending on if you want the “Strategy Tester Visualization” program to run or not.
Profit is down slightly with the tick data backtest which is quite normal, everything else is very close. The maximal drawdown is still around 33% so at this stage it would be wise to examine each trade that was taken and see what measures could be taken to reduce that without sacrificing too much profit. TUOEA has many features to explore in this quest so make sure you familiarize yourself with them all.
NOTE:
The strategy used for this tutorial is very basic and used minimal TUOEA features so that this page could be kept as short as possible. Please visit the Set Files Forum to explore the official TUOEA set files.

